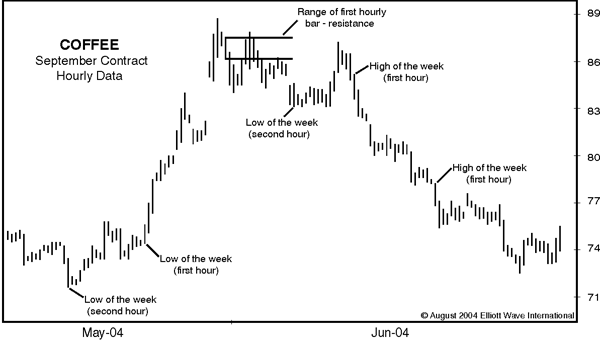
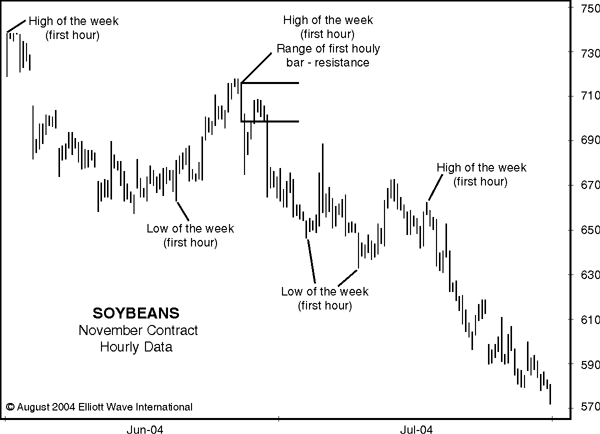
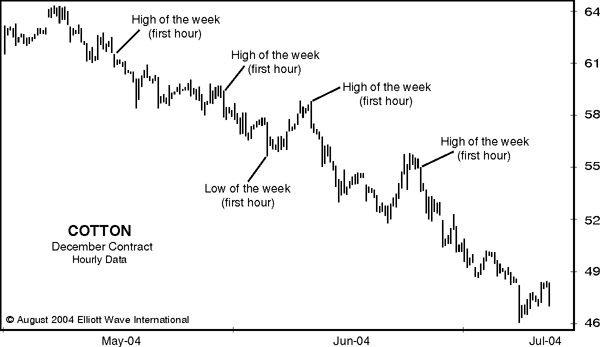
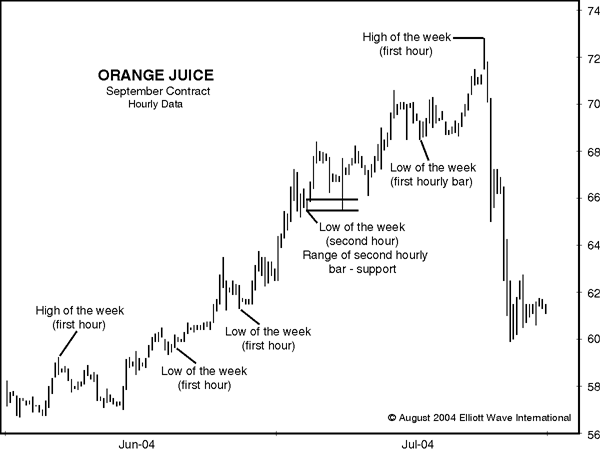
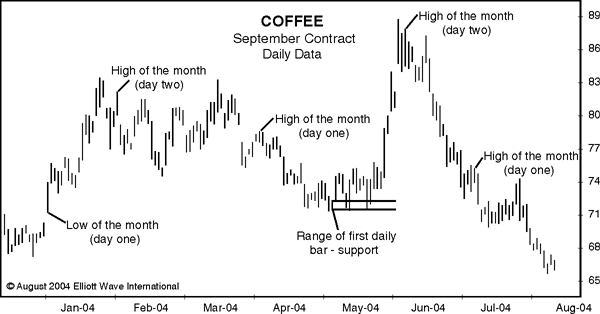
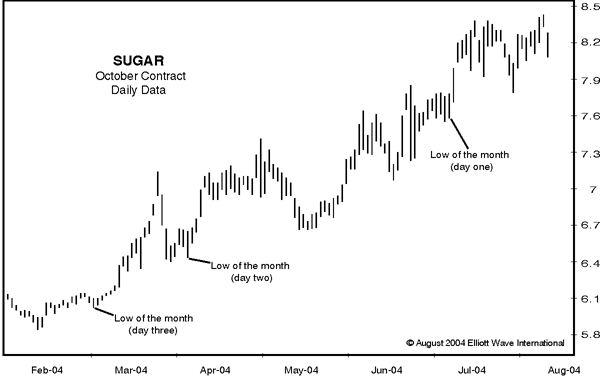
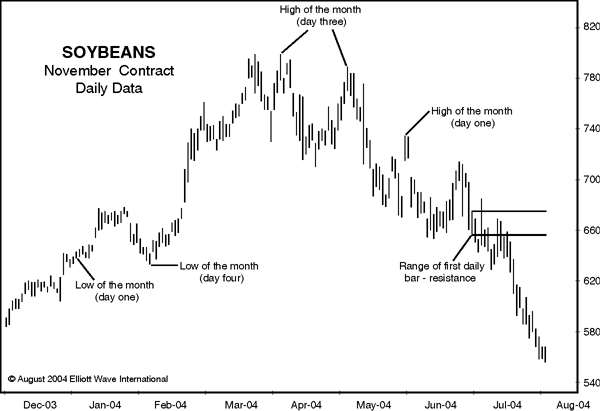
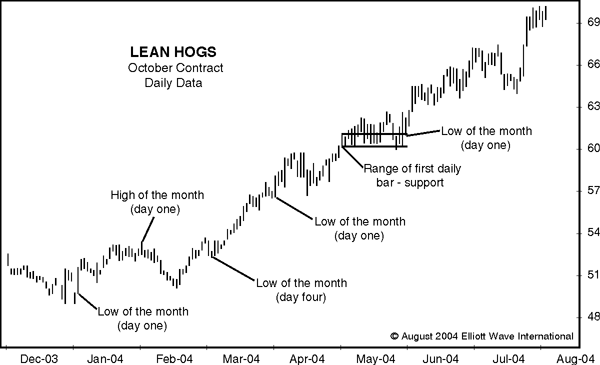
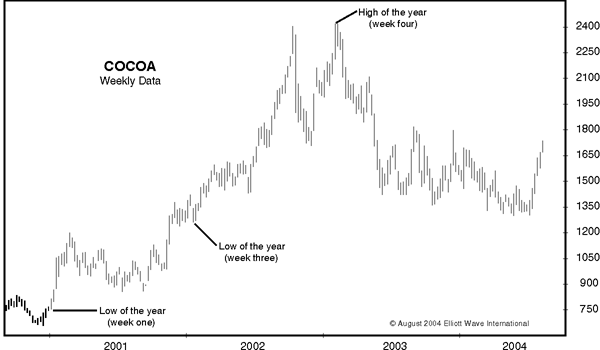
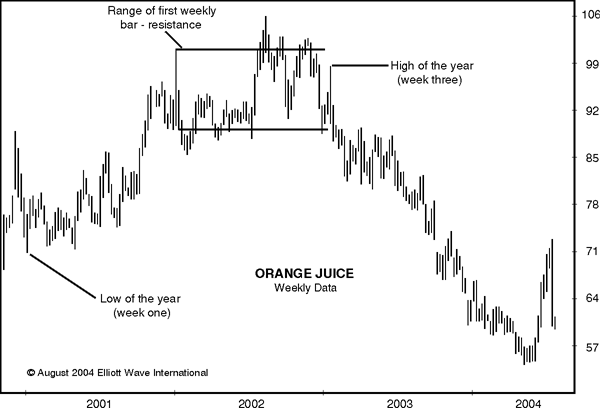
TRADER'S CLASSROOM By Jeffrey Kennedy, Editor of Elliott Wave International's Futures Junctures FIRSTS Everyone remembers their first — their first kiss, their first car or their first trade. Financial markets also seem to remember their first. Often, the high or low of the week will occur within the first few hours of trading Monday. Similarly, the high or low of the month will occur within the first few trading days of that month. Even annually, the high or low of the year will often develop within the first few weeks of trading in January. I have also found the price ranges these bars make tend to act as significant support or resistance levels for price action later in the week, month or year.
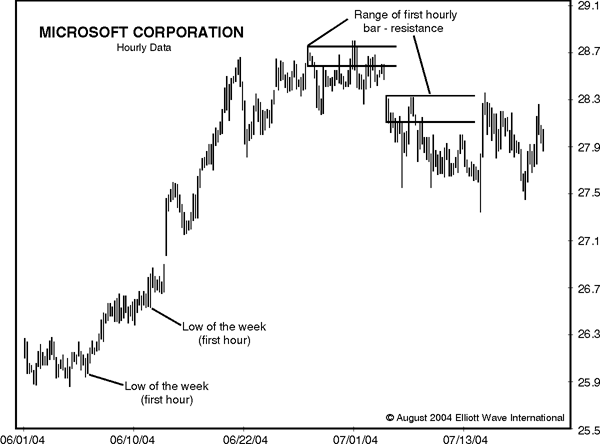
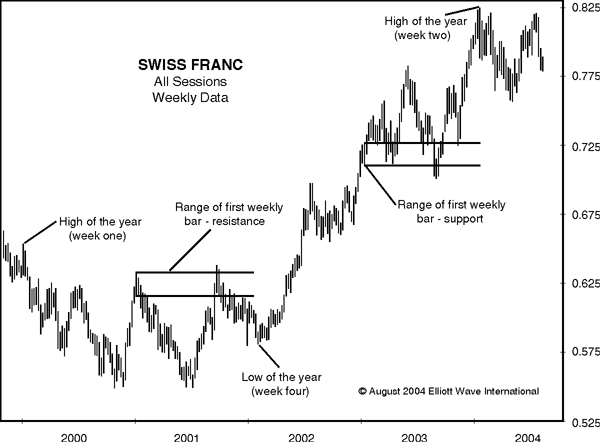
As with all my analytical tools and techniques, this rule of "firsts" has stood the test of time. I wouldn't use it unless I had found that it works on any time frame and any market with a high degree of reliability. As you can see in chart 11 (Microsoft), the same tendency of prices to register the high or low of the week within the first few hours of trading Monday is apparent. Chart 12 (Swiss Franc) shows an excellent example of this price characteristic as well. As Steve Briese of Insider Capital Group (editor of Bullish Review and Market Revolutions 1-888-423-4950) states: "Currencies usually make an extreme reading for the year — either low or high — within the first two weeks of each year." If you don't recognize the name, Steve Briese is probably the world's foremost expert on interpreting Commitment of Traders Report data. How is this technique of "firsts" useful to you as a trader? It is helpful in identifying the direction prices will move, in addition to significant support and resistance levels. As an Elliottician, it helps me time the end of impulse moves or corrections. If you would like to learn more about this technique, I highly recommend the book, The Logical Trader, by Mark Fisher. Mark has done extensive research into this technique and has incorporated it into a very successful trading methodology
EWI's futures analyst Jeffrey Kennedy watches all the major commodity and currency markets throughout each day's trading session. Then, at the end of the day, he reveals the market(s) with the most promising set up in Daily Futures Junctures. Each month in Monthly Futures Junctures, he also posts his picks for the 6-8 longer-term opportunities. Jeffrey always explains his analysis to make sure that you learn and understand how the markets move. Try
Jeffrey Kennedy's Futures Junctures Now. It's 100% Risk-Free. |
